
Texas AAPI Voter Survey — October 2026
Commissioned by The Asian Americans Texas Action Fund and conducted by Dr. Tom K. Wong, associate professor of political science and founding director of the U.S. Immigration Policy Center (USIPC) at the University of California, San Diego
Overview
In June 2026, political scientist Dr. Tom K. Wong released Texas’s first AAPI constituency-specific electoral poll, offering new insight into Asian American voters’ preferences in the U.S. Senate race. Four months later, a new survey commissioned by Asian Americans for Texas Action Fund reveals an electorate that is increasingly consequential to Texas politics, deeply concerned about affordability and family stability, and still waiting for political candidates to earn its trust.
Together, the June and October surveys reveal an electorate whose political influence is growing, but whose expectations of political leaders remain largely unchanged. Democratic candidate James Talarico maintains a substantial advantage among Asian Texan voters, while Republican candidate Ken Paxton’s unfavorable ratings have increased considerably. Yet, neither candidate has convinced most respondents that he has done enough to earn their support. Nearly two-thirds of Asian Texans continue to say Talarico needs to do more to earn their vote, a finding virtually unchanged since June.
Beyond the Senate race, the surveys reveal a consistent set of priorities. Affordability remains the defining concern for Asian Texans, while immigration concerns center on family stability, legal status, and fair treatment. These are issues that resonate across communities and reflect a shared desire for economic security, opportunity, and a better future for our families.
Despite their growing political importance, Asian Texans continue to face significant gaps in political engagement. Nearly six in 10 respondents believe candidates pay AAPI voters less attention than other communities. Fewer than one in six report direct contact from either Senate campaign, and nearly six in 10 have not seen or received election information in an Asian or Pacific Islander language.
Asian Texans have made their priorities clear. They want an economy that works for working families, opportunities to build stable and prosperous lives, fair treatment, and a meaningful voice in the decisions shaping their communities. Their political diversity also makes clear that no candidate or party can take their votes for granted.
As Texas’s electorate evolves, political leaders must recognize that meaningful representation requires more than showing up during election season. It requires sustained investment in Asian American communities, direct and culturally responsive voter outreach, accessible multilingual election information, and a demonstrated commitment to addressing the issues that matter most to Asian Texan families.
Asian American voters are an increasingly consequential force in Texas politics. Earning their trust—and their votes—requires candidates to listen to their concerns, engage their communities, and demonstrate how they will deliver for the families they seek to represent. A democracy that truly reflects Texas must be accessible to all Texans, regardless of the languages they speak or where their families come from.
Methodology & Notes
This survey includes 1,242 registered Asian American and Pacific Islander voters age 18 or older. The survey was fielded from October 4–13, 2026, using mixed-mode recruitment including online panels, text-to-survey, and traditional phones. The design employed ethnicity quotas with oversamples of South
Asian, Vietnamese, and Chinese respondents. Weights were calculated using iterative proportional fitting (“raking”) with target proportions for ethnicity, region, 2024 turnout, age, gender, and education. Weights range from 0.468 to 2.298 and have a Kish effective sample size of approximately 1,119 and a margin of error of approximately +/- 3.0%.
This survey was commissioned by The Asian Americans Texas Action Fund and conducted by Tom K. Wong, an associate professor of political science and founding director of the U.S. Immigration Policy Center (USIPC) at the University of California, San Diego. He also serves as a senior fellow at the Center for American Progress.
Key Takeaways
1. Asian Texans remain a consequential electorate in the U.S. Senate race.
Asian Americans are one of Texas’s fastest-growing populations, with nearly 2 million residents representing more than 50 ethnicities and speaking more than 100 languages. Their political participation is growing alongside their population: approximately 527,000 Asian American Texans cast ballots in the 2024 election, an 18.6% increase over 2020, according to a 2024 report from Asian Texans For Justice.
In a state where electoral outcomes can depend on turnout and relatively small shifts in voter preferences, Asian Texans represent a margin of victory whose participation could influence the razor-thin state U.S. Senate race as well as other competitive statewide races in Texas. As Texas’s Asian American population grows, so does its potential to shape the state’s political future.
2. Talarico leads by nearly 17 points.
Democrat James Talarico maintains a substantial advantage over Republican Ken Paxton among registered AAPI voters in Texas.
In October, 53.9% favored Talarico compared with 37.2% for Paxton, including respondents who initially expressed another preference or were undecided but subsequently leaned toward a candidate. Among likely voters, Talarico leads 53.9% to 37.2% including undecided voters who lean toward either candidate.
His advantage extends across several of Texas’s largest Asian American communities and metropolitan areas. He leads among South Asian, Chinese, and Filipino voters, in every major metro, and among both U.S.-born and immigrant voters.
3. Talarico has slightly expanded his support amongst Asian Texans, but we still expect him to earn our votes.
Nearly two-thirds of Asian Texans still say Talarico needs to do more to earn their vote, while expectations of Paxton have grown more critical.
In October, 65.6% agreed that James Talarico needed to do more to earn their vote, virtually unchanged from 66.2% in June. Meanwhile, 61.6% agreed that Talarico understands the concerns of Asian Texans, compared with 63.1% in June.
Perceptions of Ken Paxton have changed more substantially. More than three-quarters of respondents (76.9%) agreed that Paxton needs to do more to earn their vote, an increase of 7.4 percentage points since June. The share who believe Paxton understands Asian Texans’ concerns declined from 40.5% to 30.5%.
Talarico’s advantage has not eliminated voters’ expectations of him, and a meaningful share of the electorate remains uncommitted. Asian Texans continue to expect all candidates to demonstrate that they understand their communities’ concerns and are prepared to address their challenges.
4. Paxton’s unfavorable rating has increased by more than 20 points.
In June, preliminary polling showed 42.6% of Asian American voters reported an unfavorable opinion of Paxton. By October, that figure had risen to 63.7%—an increase of 21.1 percentage points. The growing unfavorable perception of Paxton is one of the clearest changes observed between June and October.
Only 30.5% now believe he understands Asian Texans’ concerns, down ten points since June.
5. Affordability remains the defining concern for Asian Texans.
Asian American voters want relief from the rising cost of everyday life.
In June, a preliminary poll revealed that 31.9% identified inflation and the cost of living as their most important issue in the Senate race. Our October polling confirms those preliminary results — 34.8% of Asian Texans confirmed that inflation and cost of living is their single most important issue in deciding how to vote in November’s elections.
For Asian American families across Texas, economic opportunity means more than simply finding employment. It means earning enough to afford a home, paying for healthcare, supporting aging parents, providing for children, and building a stable future. Yet too many families are being squeezed by rising costs while political leaders fail to make everyday affordability a priority.
6. Immigration matters deeply to Asian Texans, but their concerns extend far beyond border enforcement.
Immigration remains an important issue for Asian American voters, but the October survey reveals that their concerns are far more varied than conventional political debates about border security suggest.
In June, a preliminary poll of Asian Texans showed 76.3% of respondents expressed concern about delays in the legal immigration system. Our October survey explored these concerns in greater detail, asking respondents about six distinct immigration issues.
For many Asian Texans, immigration is inseparable from everyday questions of economic opportunity and family security. Long visa waits can keep loved ones apart. Uncertainty about immigration status can threaten careers, education, and the stability working Texans have worked hard to build for their families.
The findings challenge the idea that immigration concerns can be reduced to border enforcement. Asian Texans are concerned about whether the immigration system allows families to stay together, workers to contribute meaningfully to our communities and the economy, and for our communities to live with dignity and security. October concern
Green card and visa waits — 72.0% very/somewhat concerned
Enforcement affecting citizens/legal residents — 67.4% very/somewhat concerned
Students/workers losing legal status — 66.5% very/somewhat concerned
Family immigration backlogs — 64.6% very/somewhat concerned
Deportation of undocumented immigrants — 58.9% very/somewhat concerned
Unauthorized border crossings — 40.9% very/somewhat concerned
7. Asian Texans aren’t a monolith, and a substantial portion are independent voters who can still sway a tightly-competitive statewide race.
Asian American Texans represent dozens of ethnicities, languages, immigration histories, and political perspectives. The October survey underscores why their political preferences cannot be reduced to a single voting bloc.
Among South Asian respondents, Talarico leads Paxton by nearly 34 points. Among Chinese respondents, he leads by approximately 17 points. But among Vietnamese respondents, Paxton holds a narrow advantage.
Among October respondents identifying as independents, 45.6% favored Talarico, 33.6% favored Paxton, and 19.7% remained undecided after candidate leaners were incorporated.
Asian Texans can’t be treated as a monolith or taken for granted. And our political power comes from the growing participation of communities with distinct experiences, priorities, and political beliefs.
8. Language access remains a significant gap in election information.
The October survey reveals another important barrier to meaningful political participation: access to election information in the languages Asian Texans use.
Only 33.7% of respondents reported seeing or receiving election information in an Asian or Pacific Islander language during the 2026 election.
Meanwhile, 59.3% reported receiving or seeing no such information.
Texas’s Asian American communities speak more than 100 languages, and many families rely on multilingual information to navigate public services, government institutions, and elections.
The availability of accessible, culturally relevant election information is therefore an important part of ensuring that every eligible voter can participate meaningfully.
Language access is not simply a matter of translation. It is about whether voters can understand the choices before them, receive reliable information, and exercise their rights with confidence.
The survey does not establish that every respondent who lacked in-language election information needed it. But it does reveal the limited reach of multilingual election communications across the electorate.
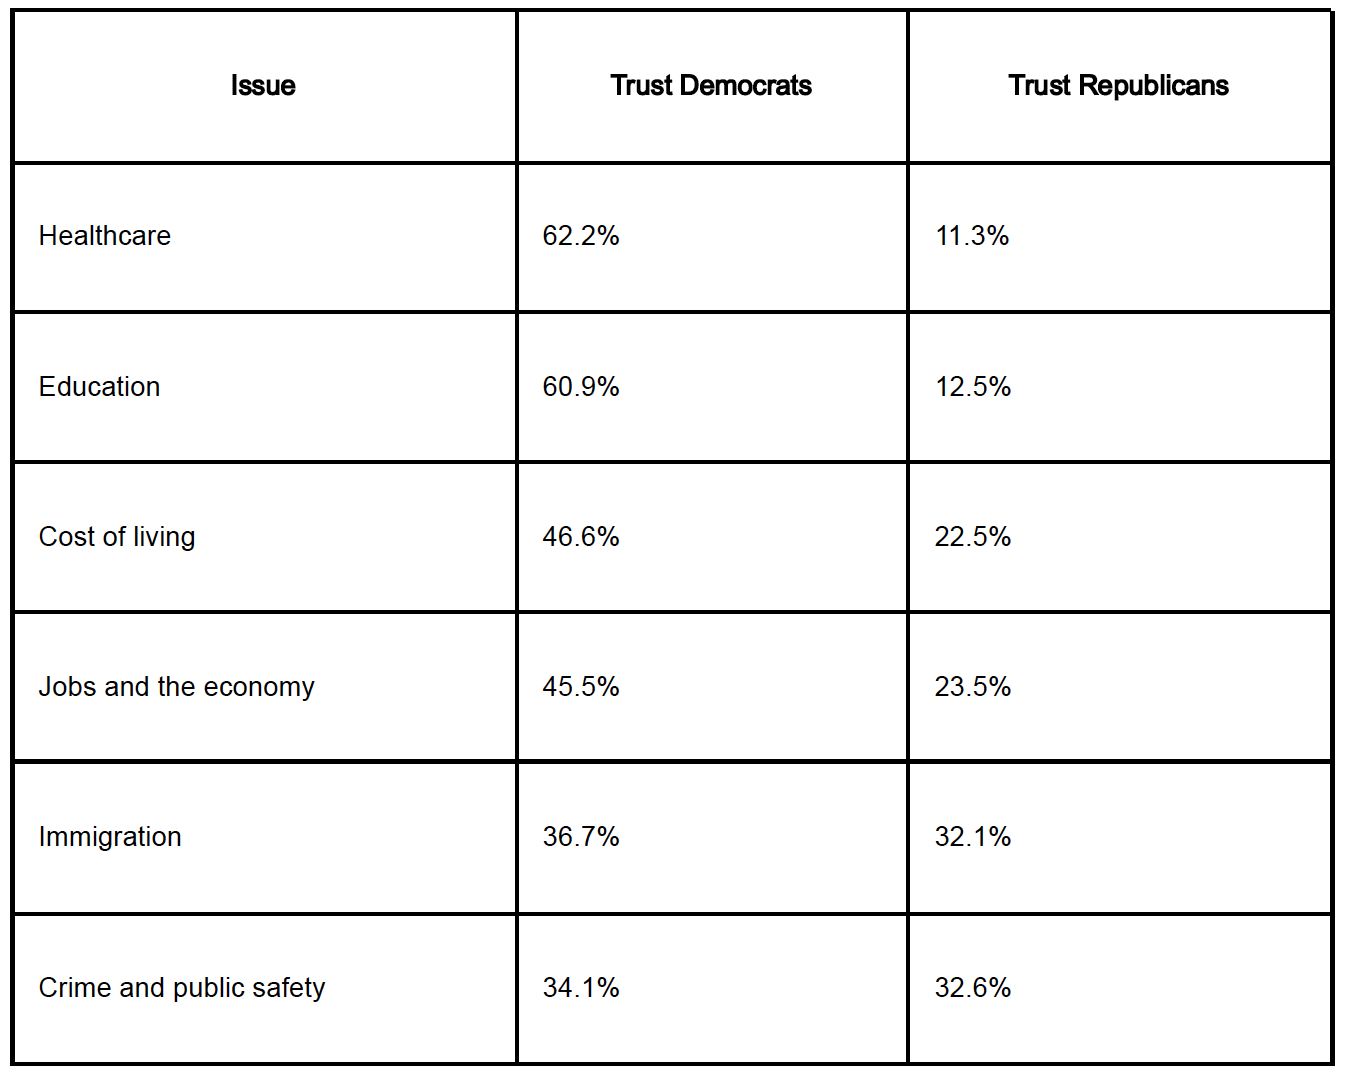
9. Asian Texans trust Democrats more on economic opportunity, healthcare, and education—but remain divided on immigration and public safety.
Democrats hold particularly large advantages on healthcare and education, with approximately six in ten respondents identifying them as the party they trust more on these issues. However, respondents are more closely divided on immigration and public safety, where neither party commands a comparable advantage.
Asian American Texans are choosing Talarico.
James Talarico leads Ken Paxton by 17 points among registered Asian American and Pacific Islander voters. AAPI voters reject Paxton, trust Democrats on the cost of living, and most have not yet been contacted by a campaign.
Talarico leads by 17 points.
Talarico leads among AAPI voters before leaners are counted, and the lead widens once they are included: 54% to 37% overall, 53% to 38% among likely voters. He leads among South Asian, Chinese, and Filipino voters, in every major metro, and among both U.S.-born and immigrant voters.
Senate preference among registered voters
Senate preference among respondents who had not yet voted.
Question wording
Options: James Talarico / Ken Paxton / Someone else / Undecided; follow-up leans
Talarico’s lead holds across communities.
Switch between ethnicity, party identification, region, nativity, age, and 2024 presidential vote. The bars show each group’s weighted Senate preference.
Talarico holds his base. Paxton doesn’t.
Weighted Senate vote including leaners, by 2024 presidential vote. Talarico keeps more of the Harris coalition than Paxton keeps of Trump’s, and he wins three times as many crossover voters.
Nearly 9 in 10 Harris voters back Talarico. Fewer than 8 in 10 Trump voters back Paxton.
About 1 in 9 AAPI Trump voters back Talarico. Only about 1 in 26 Harris voters back Paxton.
AAPI voters know Paxton, and they reject him.
Paxton is widely known and deeply unpopular, with a net favorability of −39. Talarico is less well known, but voters who know him like him (+18 net), and a quarter of the electorate is still forming an opinion. That gives Talarico room to grow, while Paxton has little.
Talarico’s net favorability (46.9% favorable, 29.2% unfavorable). Another 23.9% haven’t heard of him or aren’t sure, so he still has room to grow.
Paxton’s net favorability (24.3% favorable, 63.7% unfavorable), with 42.7% very unfavorable. Only 11.9% have no opinion of him.
Have heard a great deal or some about James Talarico.
Have heard a great deal or some about Ken Paxton.
Candidate favorability
Favorable, unfavorable, unfamiliar, and uncertain responses are all retained in the distribution.
Question wording
Options: Awareness: A great deal / Some / Just a little / Nothing at all. Favorability: Very favorable / Somewhat favorable / Somewhat unfavorable / Very unfavorable / Never heard of him / Not sure.
Talarico understands AAPI Texans. Paxton doesn’t.
Talarico is twice as likely as Paxton to be seen as understanding the concerns of Asians in Texas (61.6% vs. 30.5%). Combined strongly agree and somewhat agree. A voter can agree that a candidate understands AAPI concerns and also that the candidate needs to do more.
Question wording
Options: Strongly agree / Somewhat agree / Somewhat disagree / Strongly disagree.
On the issue that matters most, AAPI voters trust Democrats.
Cost of living is the top issue: 43% name it among their top three and 35% call it their single most important. AAPI voters trust Democrats over Republicans on cost of living by 24 points, on the economy by 22, and on healthcare and public education by roughly 50.
What will decide the vote?
Toggle between the three-issue selection and the single top priority. The single-issue question was answered by people who chose a substantive issue in the preceding question.
Question wording
Options: Q18: select up to three; Q19: select one of the issues identified at Q18.
Democrats are trusted more on every issue tested.
Democrats lead on all six issues. The margins are largest on healthcare (+51), public education (+48), cost of living (+24), and jobs (+22). Percent choosing each party. Both equally, neither, and not sure are excluded from these two plotted columns.
Question wording
Options: Democratic Party / Republican Party / Both equally / Neither / Not sure.
The biggest opportunity: most AAPI voters haven’t been contacted.
Only 16% of AAPI voters say the Talarico campaign has contacted them, and 59% say candidates pay AAPI voters less attention than other communities. These voters already lean toward Talarico, so direct outreach could add to his margin.
Report being contacted by the Talarico campaign. 74.3% say they have not been (Paxton: 11.0%).
Say candidates generally pay AAPI voters less attention than other communities in Texas.
Report no election-related contact from any of the listed groups or organizations.
How outreach arrives
Among respondents who reported a contact (n = 689), share reporting each channel. Multiple responses permitted.
Question wording
Options: Door knock / Phone call / Text message / Mail / Email / Social media / Community event / Religious or faith event / Other.
Seeing election information in an AAPI language
One-third report receiving or seeing political or voting information in an Asian or Pacific Islander language. The share is highest among Vietnamese (47%) and Chinese (40%) voters and foreign-born voters (41%). These are effective channels for reaching the most competitive communities.
Question wording
Options: Yes / No / Not sure.
AAPI voters’ immigration worries center on legal immigration, not the border.
72% are concerned about green card and visa waits, and 67% about enforcement that affects citizens and legal residents. Only 41% are concerned about border crossings. That gives Talarico an opening on immigration, an issue where the parties are otherwise close (37% trust Democrats, 32% Republicans).
Six distinct concerns about the immigration system
Weighted percentages. “Concerned” is very concerned plus somewhat concerned; all five categories appear in the bars.
Question wording
Options: Very concerned / Somewhat concerned / Not too concerned / Not at all concerned / Not sure.
A Democratic-leaning electorate with many independents up for grabs.
Democrats outnumber Republicans by 10 points, and independents who lean toward a party lean Democratic by nearly 4 to 1.
Party identification
All registered AAPI respondents, weighted. Initial party identification is shown without reclassifying independents by their lean.
Question wording
Options: Q1: Democrat / Republican / Independent / Something else. Q4: Democratic Party / Republican Party / Neither.
Immigrant generation
Were born outside the United States; 39.4% say they were U.S.-born, and 0.9% preferred not to say.
Methodology.
This survey includes 1,242 registered Asian American and Pacific Islander voters age 18 or older. The survey was fielded from October 4–13, 2026 using mixed-mode recruitment including online panels, text-to-survey, and traditional phones. The design employed ethnicity quotas with oversamples of South Asian, Vietnamese, and Chinese respondents. Weights were calculated using iterative proportional fitting (“raking”) with target proportions for ethnicity, region, 2024 turnout, age, gender, and education. Weights range from 0.468 to 2.298 and have a Kish effective sample size of approximately 1,119 and a margin of error of approximately +/- 3.0%.
Disclaimer: Paid for by The Asian Americans Texas Action Fund. Not authorized by any candidate or candidate’s committee. The information in this report is for educational and advocacy purposes.